Underground Natural Gas Working Storage Capacity
Demonstrated peak capacity for natural gas storage increased in 2023
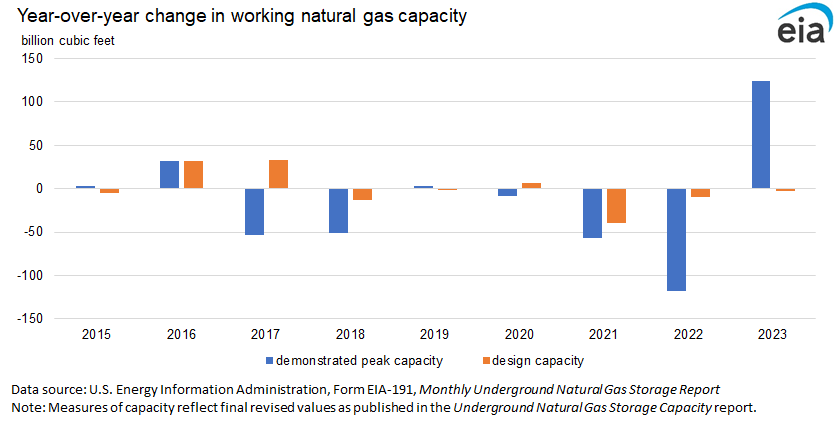
Underground working natural gas storage capacity in the Lower 48 states increased in 2023. We use two metrics to assess working natural gas storage capacity. The first metric—demonstrated peak capacity—rose 3% by 124 billion cubic feet (Bcf) in 2023, reflecting the increased use of natural gas storage due to market conditions. The second metric—working gas design capacity—fell close to 0.0%, or 3 Bcf, in 2023. Underground natural gas storage capacity continues to play an important role in balancing energy needs in the United States, regardless of how it is measured.
- Demonstrated peak capacity:
Demonstrated peak capacity, or total Maximum demonstrated working natural gas capacity, represents the sum of the largest volume of working natural gas reported for each individual storage field during the most recent five-year period, regardless of when the individual peaks occurred. This report considers demonstrated peaks from December 2018 through November 2023. Demonstrated peak capacity is based on survey data from Form EIA-191 and is typically less than design capacity because it relates to actual facility usage, rather than potential use based on the design of the facility. Several factors can influence changes in demonstrated peak capacity over time, including:
– New capacity additions
– Existing storage field abandonments
– Commercial and regulatory decisions about storage fields
– Shifts in regional fuel use due to electricity market changes
– Significant departures from normal temperatures for extended periods
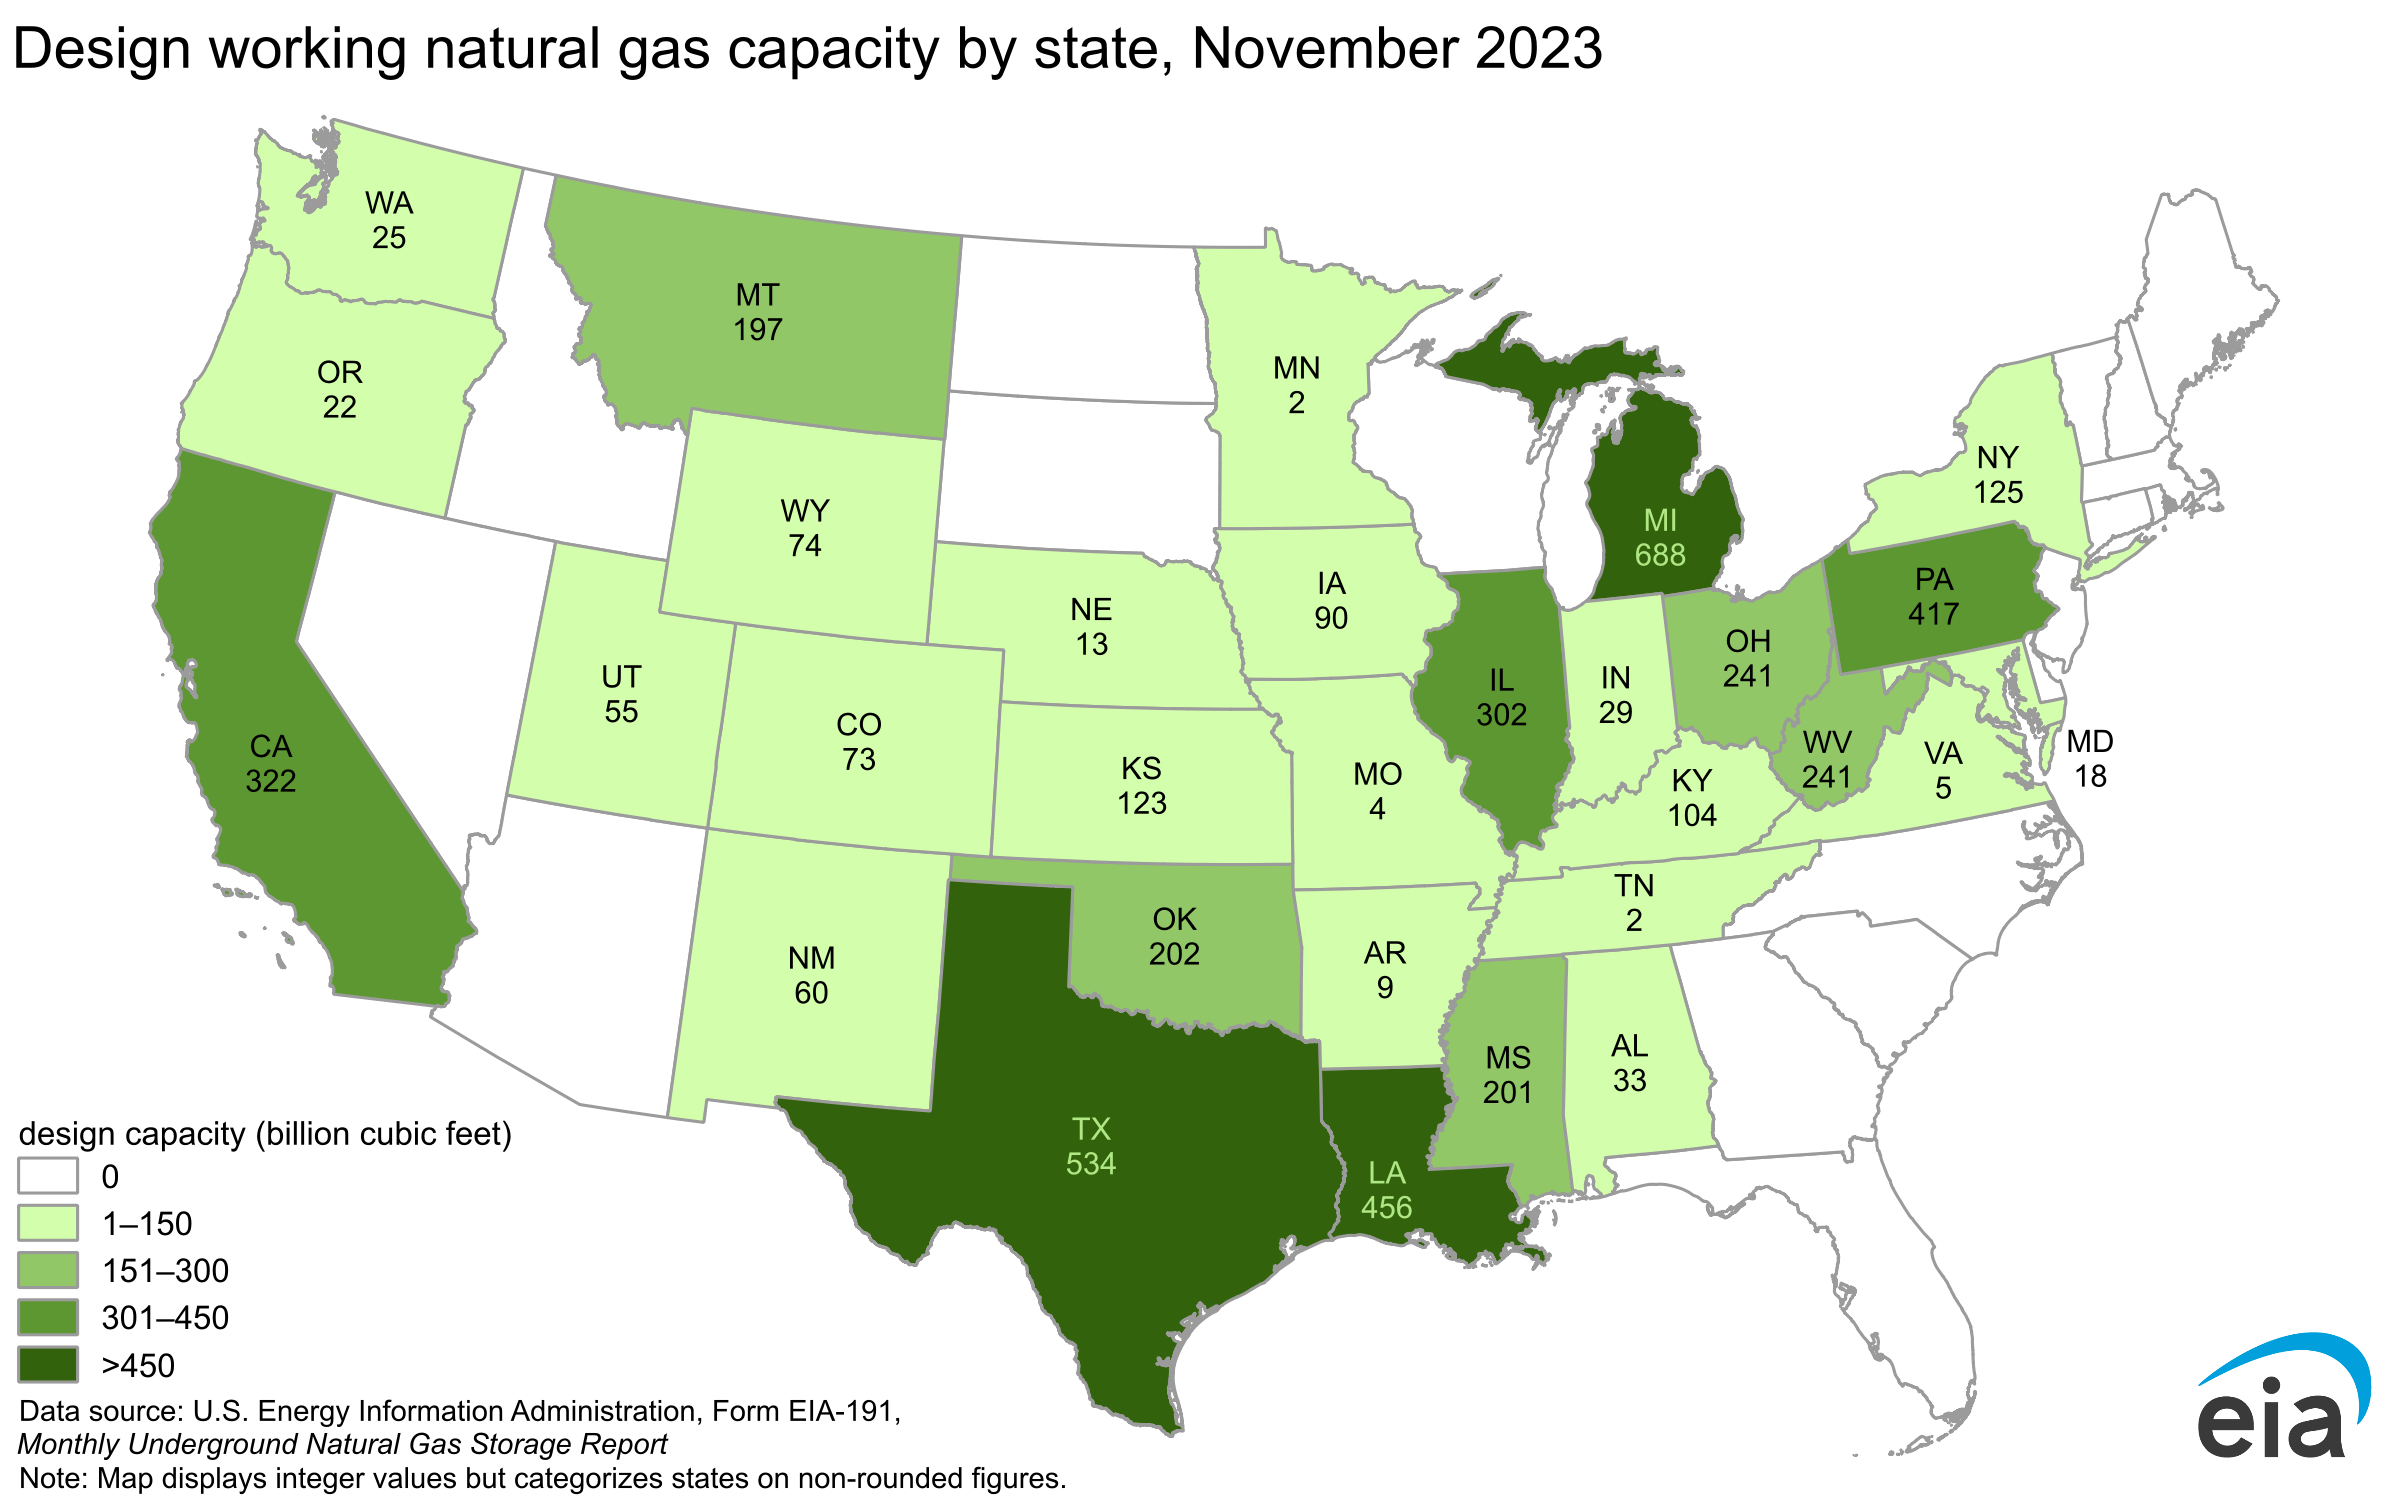
- Design capacity: Design capacity, sometimes referred to as nameplate capacity, is based on the physical characteristics of the reservoir, installed equipment, and operating procedures on the site, which often must be certified by federal or state regulators. We calculate total design capacity as the sum of the reported working natural gas capacities of the 384 active storage fields in the Lower 48 states as reported on Form EIA-191, Monthly Underground Natural Gas Storage Report, as of November 2023. This total excludes 28 inactive fields. The design capacity metric represents a theoretical limit on the total amount of natural gas that can be stored underground and withdrawn for use.
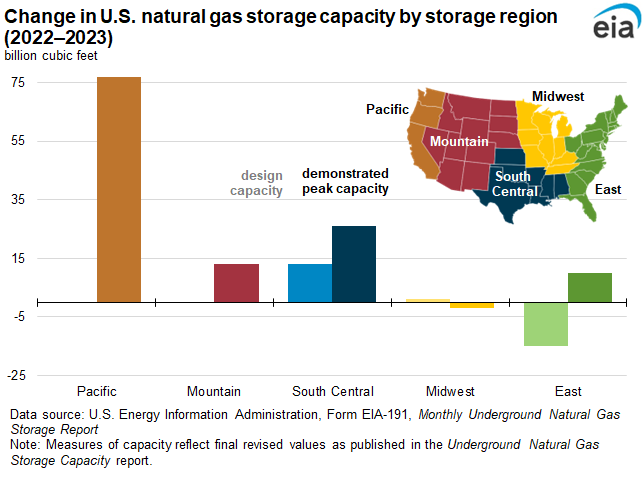
Demonstrated peak capacity increased in four of five of EIA's storage regions.
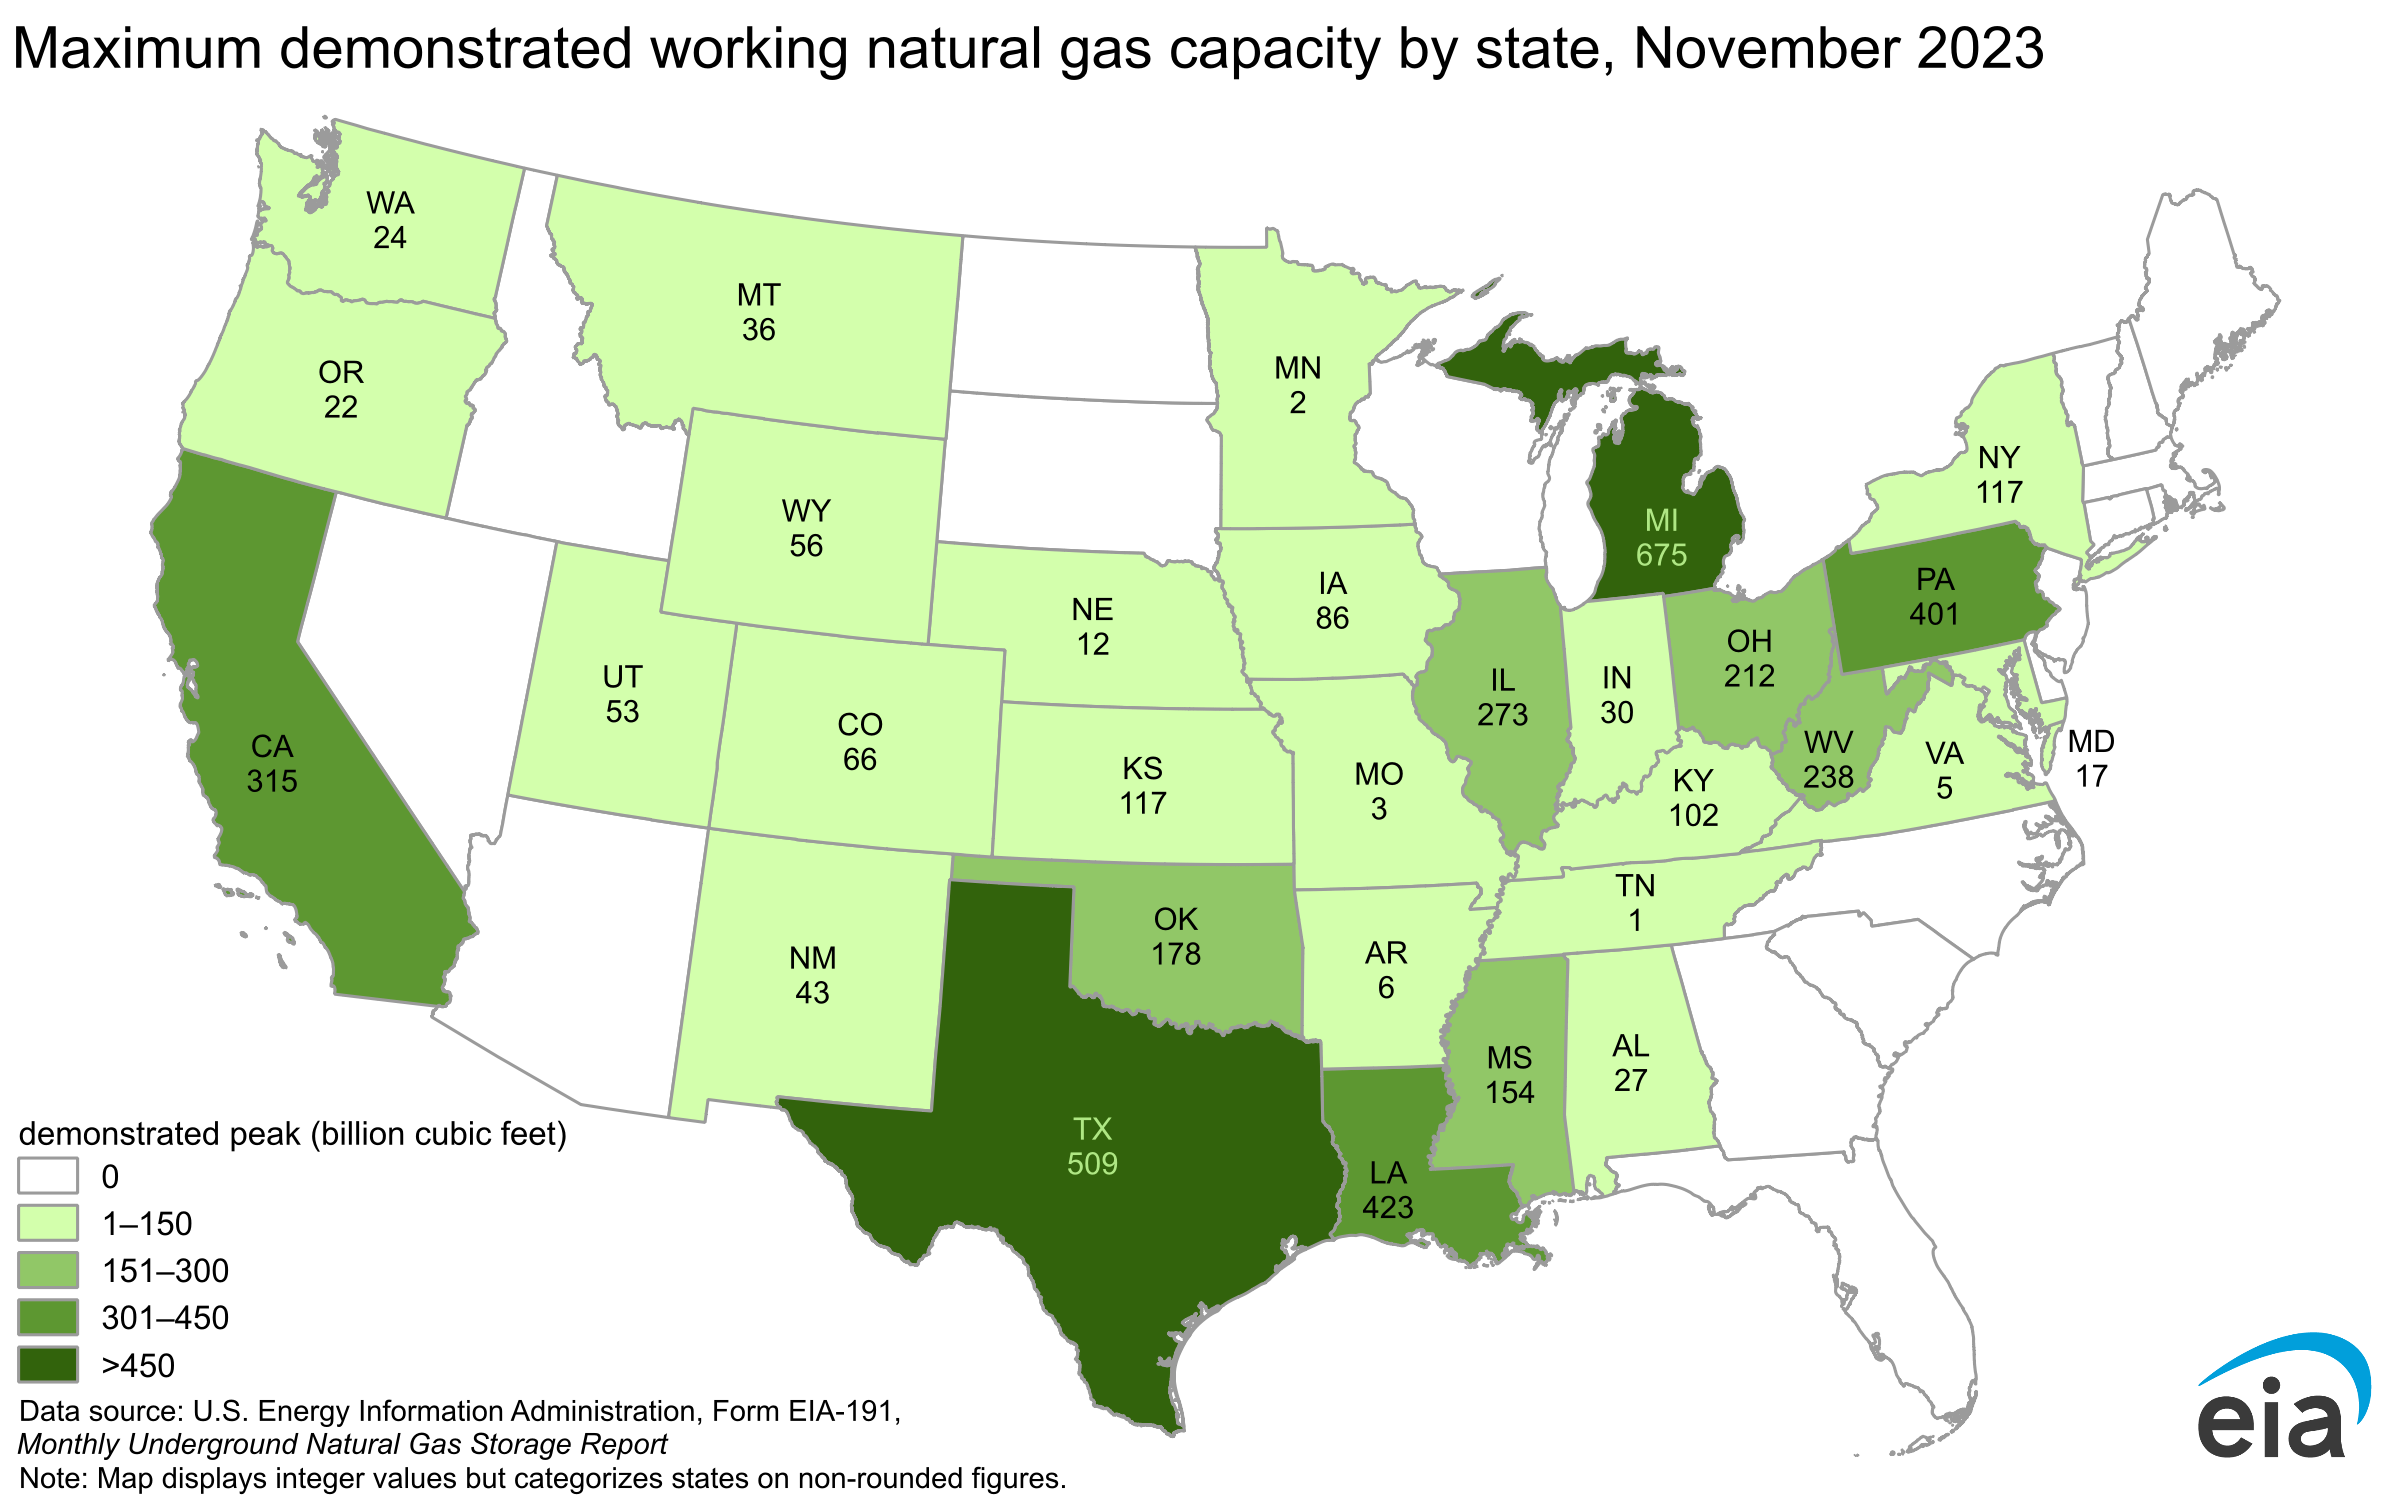
Demonstrated peak capacity for the Lower 48 states climbed 3% (124 Bcf) during the November 2023 report period, which ran from December 2018 through November 2023, compared with the November 2022 report period, which ran from December 2017 through November 2022.
This period’s increase in the demonstrated working natural gas capacity in the Lower 48 states ends a three-year streak of falling capacity, and it represents the largest year-over-year increase in EIA’s 10-year history of the tracking this metric dating back to 2015. This year’s increase in peak demonstrated capacity was due mostly to comparing storage use that included the low demonstrated peak stock year of 2022 (4,079 Bcf) as well as a material change in California’s natural gas regulation to facilitate energy market reliability ahead of the winter of 2023–24.
Demonstrated peak natural gas storage capacity in the United States had fallen in recent years, declining in five out of the last seven years since reaching its highest level on record, 4,362 Bcf in 2017 (covering 2011–16). The declines in demonstrated peak capacity reflected less use of existing natural gas storage fields and less investment in new storage fields and expansions. The largest decreases during this period occurred in the Pacific region, accounting for nearly 47% (132 Bcf) of the reduction in demonstrated peak capacity in the Lower 48 states. In the aftermath of the natural gas leak in 2015, the natural gas facility at Aliso Canyon has operated with reduced effective capacity since the California Public Utilities Commission (CPUC) granted conditional approval for limited natural gas injections at the facility.
These restrictions were eased somewhat in 2023 when the CPUC voted to increase the regulatory cap on the Aliso Canyon natural gas storage facility. The Commission authorized increasing the working gas capacity at Aliso Canyon in late August by 67% to 68.6 Bcf. In the wake of the regulatory change, net injections of natural gas into Aliso Canyon rose, increasing working gas stored in the Pacific region and in maximum demonstrated capacity.
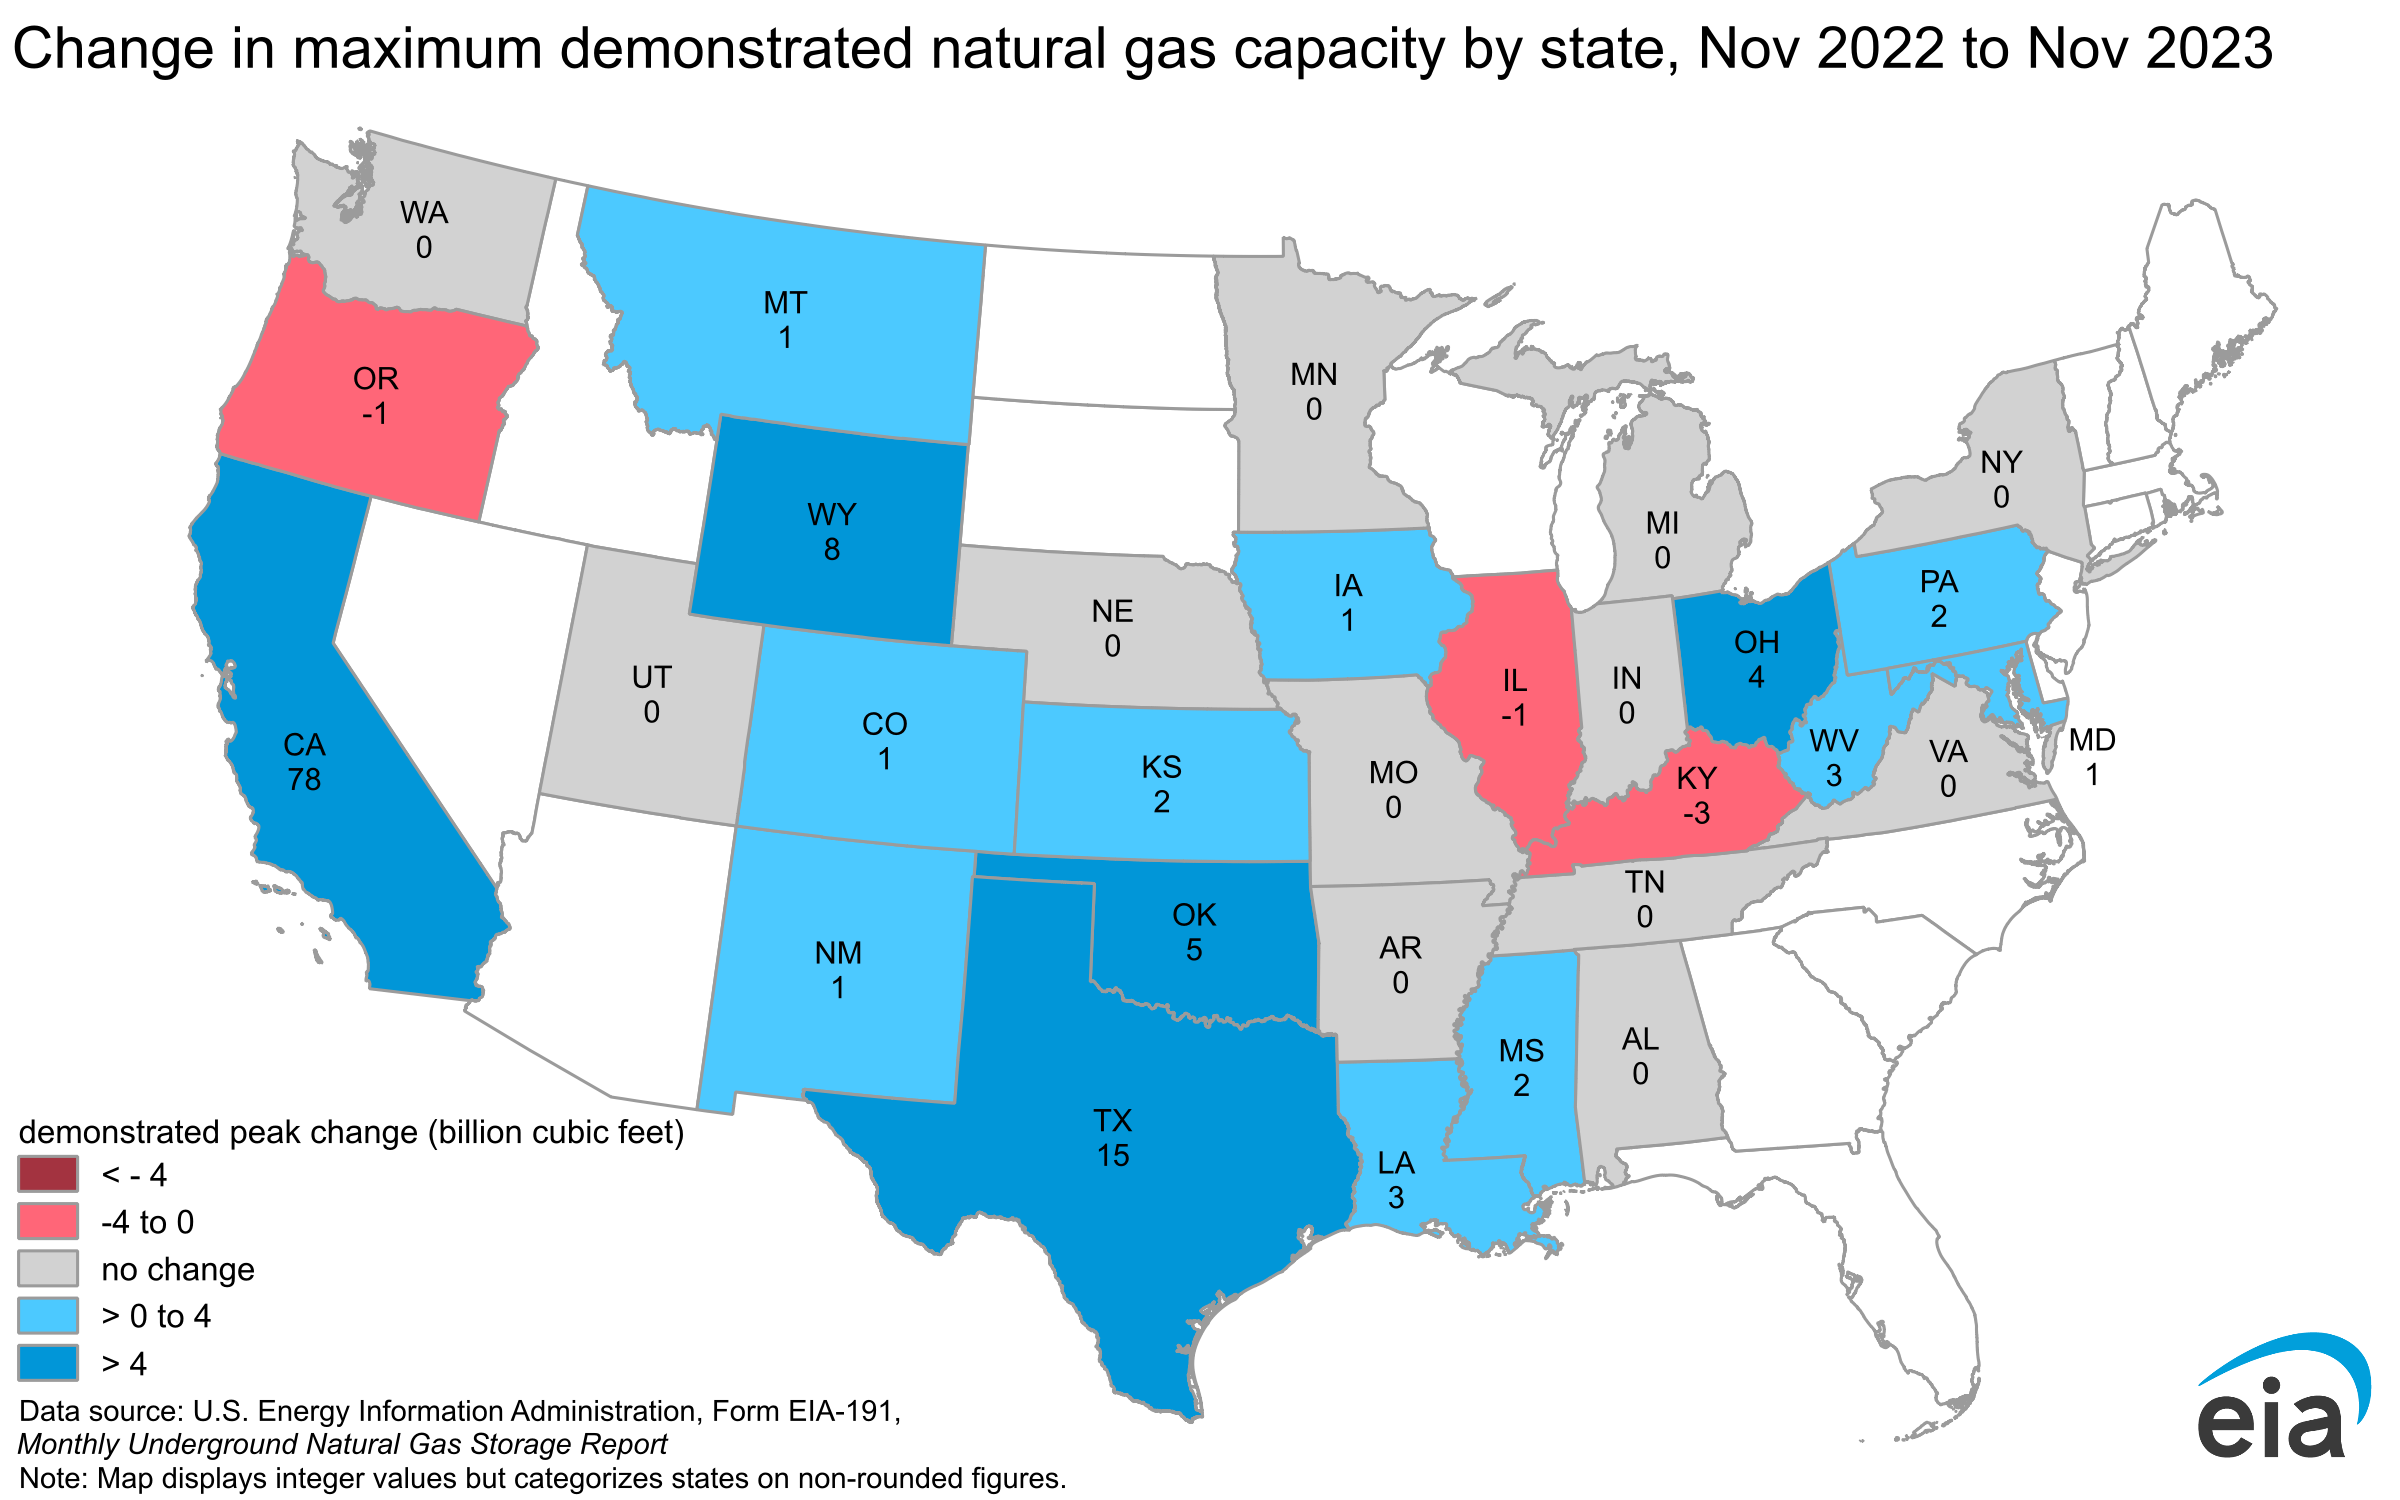
By far, the largest increases occurred in the Pacific region where demonstrated peak capacity increased 27% (124 Bcf). The South Central salt and nonsalt regions reported smaller increases of 4% (16 Bcf) and 1% (11 Bcf), respectively. The Mountain region also reported significant gains over the year-ago level, rising 5% (12 Bcf), while the East region increased 1% (10 Bcf). The Midwest region reported the only regional decrease on the year of 0.2% (3 Bcf).
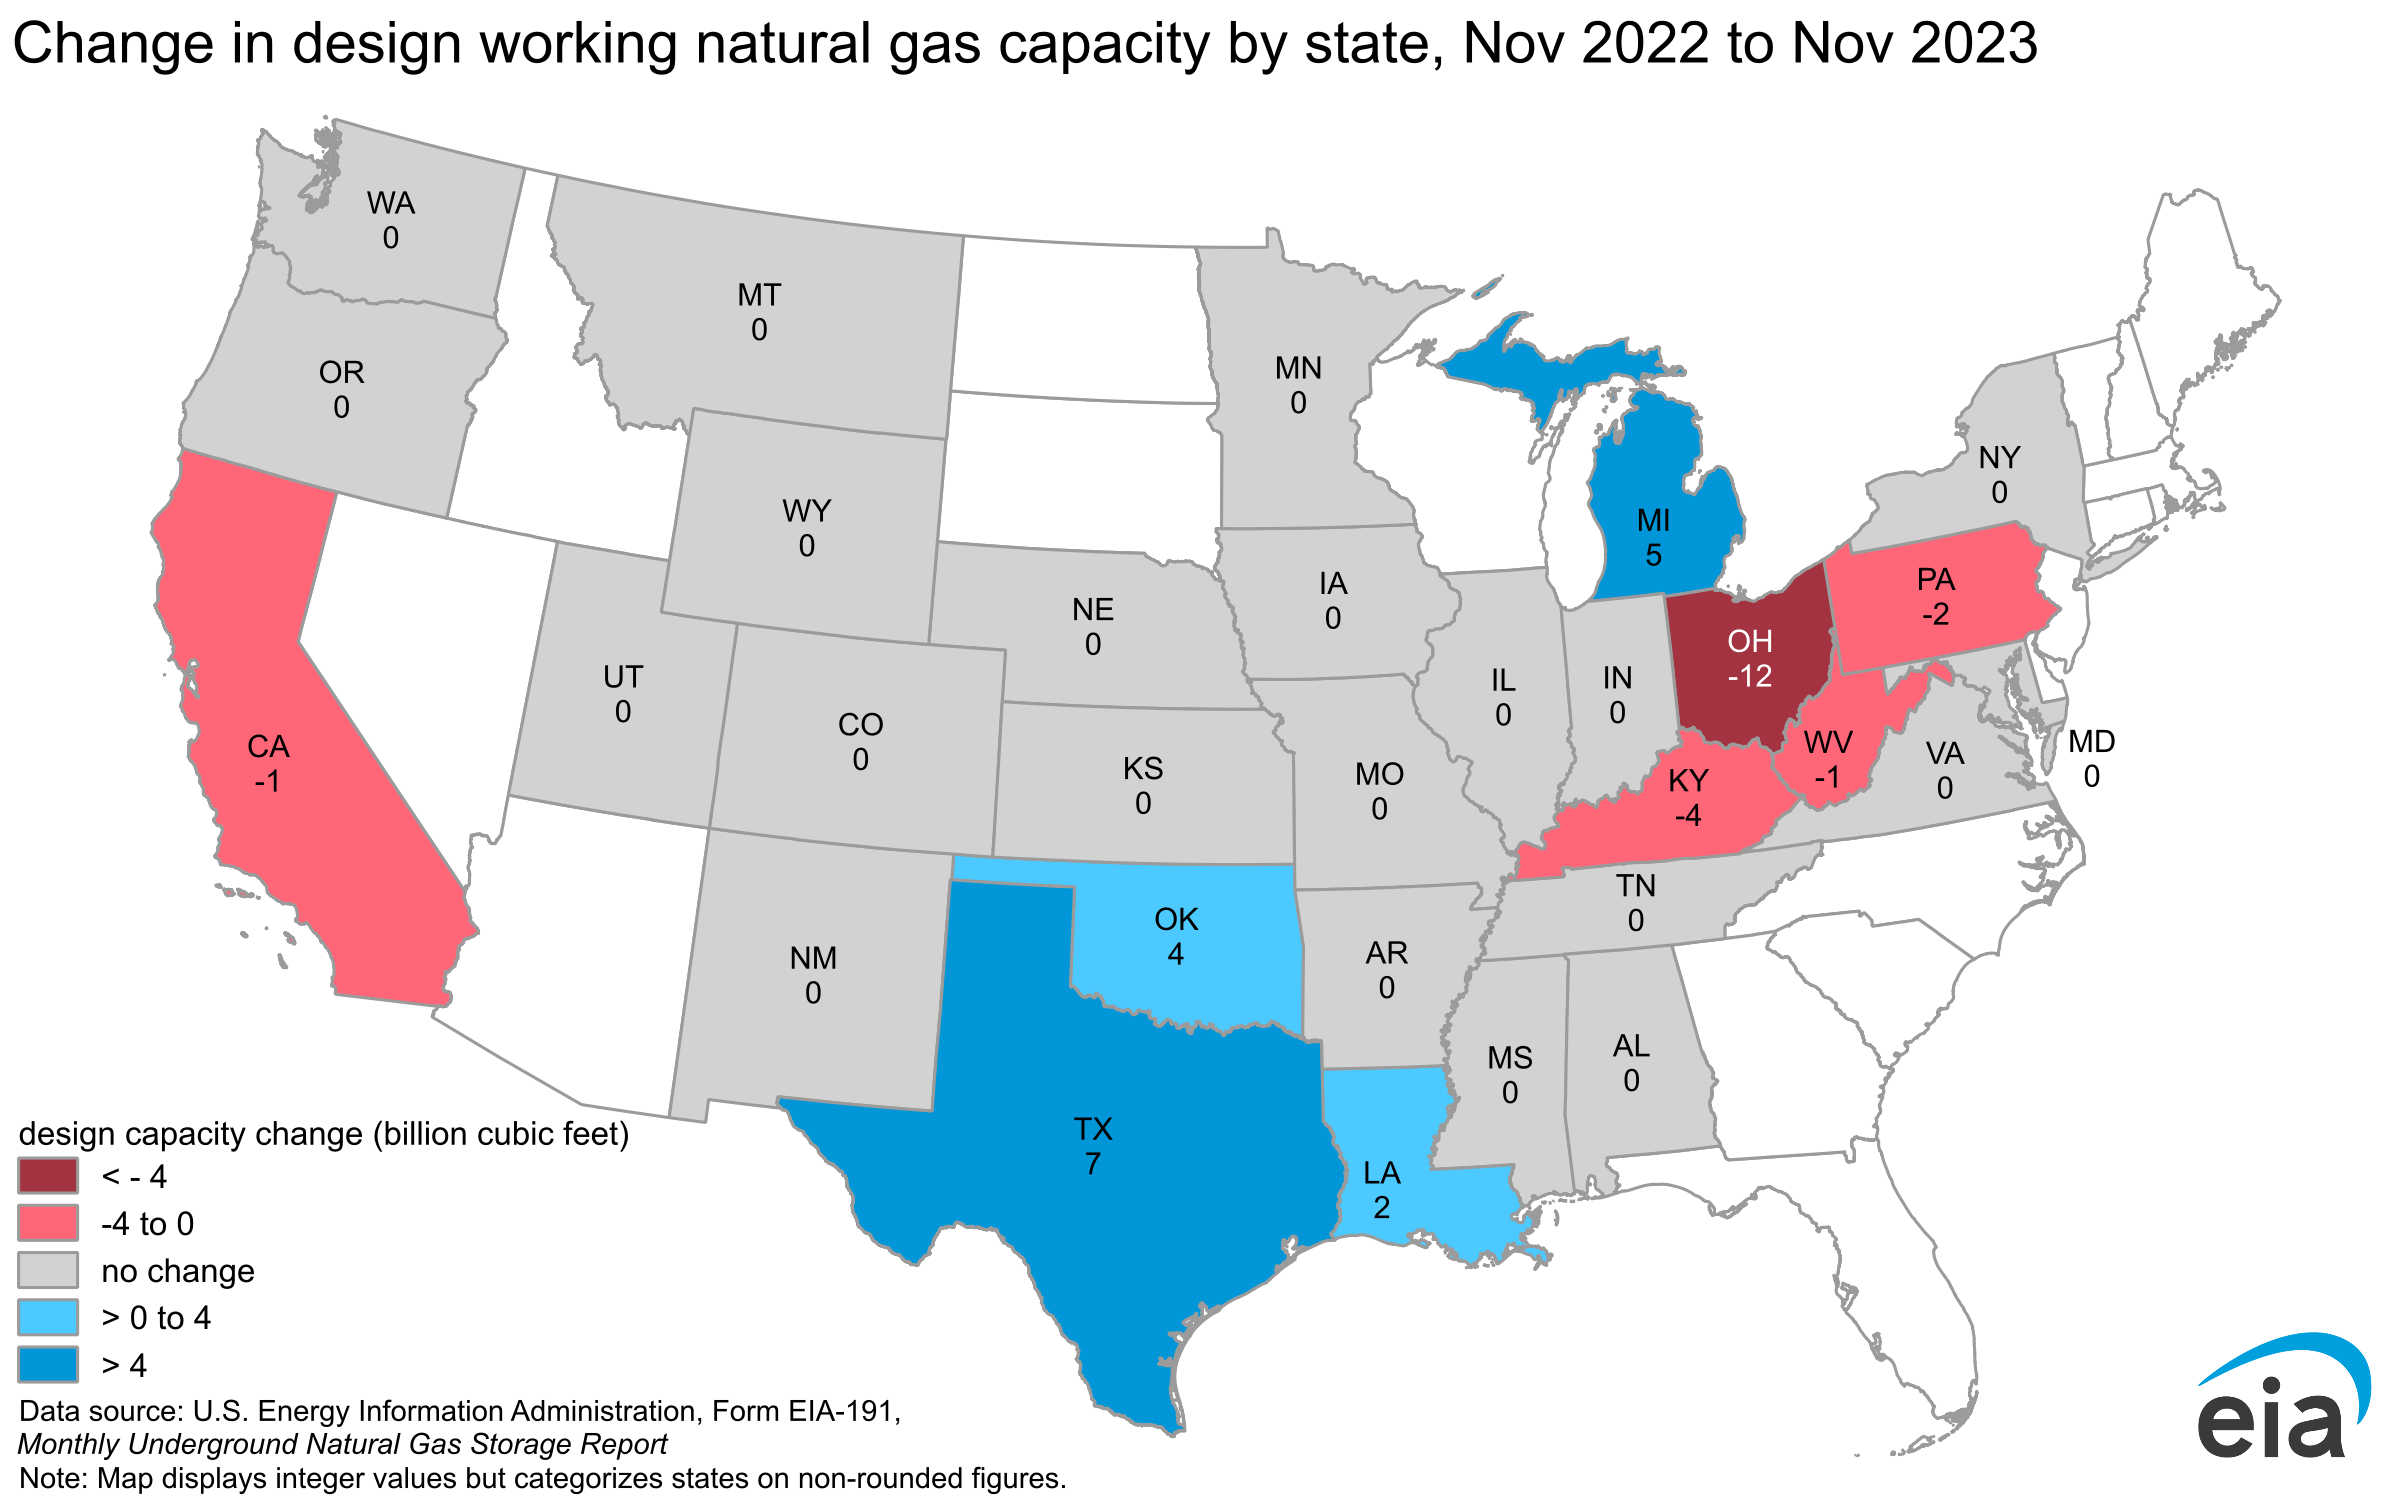
Overall natural gas storage design capacity fell in 2023, with declines in East region capacity exceeding South Central region capacity additions. Design capacity of underground natural gas storage facilities in the Lower 48 states were essentially unchanged, falling by 3 Bcf in November 2023 compared with the previous year. Working gas design capacity declined 15 Bcf in the East region primarily due to base gas adjustments in the region. Increases in the South Central region totaled 13 Bcf, with expansions to nonsalt facilities totaling 4 Bcf and salt facilities adding 9 Bcf. The Midwest region reported a slight increase of about 1 Bcf, while working gas design capacity in the Pacific and Mountain regions remained unchanged from the previous year. Overall, increases in storage capacity in the South Central region offset regional decreases reported elsewhere.
- A base gas restoration program on the Columbia Gas Transmission system decreased working gas capacity in the East region by nearly 15 Bcf. Purchases of natural gas restored base gas levels to historical levels at Columbia’s storage facilities. These increases in base gas reduced working gas capacity as total design capacity at these facilities remained unchanged at the FERC-certificated levels.
- Three projects added to capacity in the South Central region. Atmos Pipeline reported the development of a third salt cavern at Bethel, adding 7 Bcf of working gas design capacity. Egan Hub Partners reported an increase totaling nearly 4.5 Bcf in the working gas capacity at the Egan Storage Dome, following a temporary reduction in capacity in 2022 for a workover maintenance project. In the nonsalt South Central region, OneOk Gas Storage reduced the base gas level at one of its fields, resulting in a 4 Bcf increase in working gas capacity at the facility.
- Two capacity changes nearly offset each other in the Midwest region. In Michigan, the Washington 10 Gas Storage facility reported an increase in total capacity of nearly 3.5 Bcf. In Kentucky, the Louisville Gas and Electric Company reported the closure of its Doe Run Storage Field, accounting for a capacity reduction of 4 Bcf.
Market conditions can affect the growth of natural gas storage capacity. The natural gas storage industry’s need for new capacity to balance the natural gas market has been influenced by offsetting trends in recent years. Current market factors can more immediately affect demonstrated peak capacity because increasing utilization of existing facilities can be accomplished more readily than adding or building more storage capacity. As a result, increases in natural gas storage design capacity take longer to occur.
The following are some market factors contributing to less need for incremental storage capacity:
- Increased natural gas production lowered natural gas prices and enabled some customers to meet their natural gas supply needs without, for the most part, using natural gas storage services.
- Increased utilization of existing high-deliverability storage capacity meant some customers could get the supply and risk management services they needed without needing to sign up for incremental capacity.
- Increased pipeline capacity and interconnectivity helped customers optimize buying and transporting natural gas.
- Growth in natural gas demand has slowed somewhat in the residential and commercial sectors; seasonal reliability requirements for these sectors have anchored typically long-term, firm-contract storage capacity needs.
- Small seasonal differences between the average price of winter and summer natural gas—at times—reduced economic incentives for buying physical natural gas and incurring storage service-related carrying charges. Tight seasonal spreads during some years, due in part to rapid shale gas production growth and sometimes weather, may have moderated storage capacity expansion. The New York Mercantile Exchange (NYMEX) forward curve now shows greater price differences between average summer and winter prices, indicating a likely greater need for storage capacity to address seasonal differences in forward prices.
However, other energy market changes likely signal greater need for storage capacity, especially flexible, high-deliverability storage, including the need to:
- Account for the ongoing penetration of intermittent sources of generation such as wind and grid-scale photovoltaic electricity (High deliverability storage helps commercial market participants manage daily and intraday changes in net load—or total electricity load minus solar and wind generation.)
- Balance flexible receipts and deliveries to the growing South Central region pipeline and LNG export markets
- Support fast-ramp supply needs for natural gas-fired generators
- Provide a physical hedge against changes in natural gas prices and volatility
Working natural gas in storage ended the 2023 refill season 5% above the five-year average.
Despite robust natural gas production, increased electric power and export demand for natural gas reduced injections into storage. The industry reported below-average net injections into working gas in all regions west of the Rocky Mountains. However, higher-than-normal inventory levels at the beginning of the refill season in the East, Midwest, and South Central regions, as a result of a relatively mild heating season, likely played a significant role in easing injection demand for natural gas.
Colder-than-normal temperatures during winter 2022–23 contributed to reduced inventories in the Pacific and Mountain regions, resulting in summer injections that exceeded the five-year average to replenish working natural gas inventories. The Pacific and Mountain regions entered the 2023 refill season below the five-year average by 56.8% and 10.1%, respectively. Injections into working natural gas in these regions continued through the week ending November 24 and ended the refill season well above the five-year average. Current stocks in both regions exceed their highest levels since 2019.
As we publish this updated storage capacity analysis, all five EIA storage regions have inventories above the five-year (2019–2023) inventory range. We publish updates to these statistics each week in EIA’s Natural Gas Storage Dashboard.
| Demonstrated peak capacity1 | Design capacity2 | Demonstrated peak capacity share of design capacity3 | ||||||||||||||||||||||||||||||||||||||||||||||||||||||||||||||||||||||||||||||||||||||||||||||||
|---|---|---|---|---|---|---|---|---|---|---|---|---|---|---|---|---|---|---|---|---|---|---|---|---|---|---|---|---|---|---|---|---|---|---|---|---|---|---|---|---|---|---|---|---|---|---|---|---|---|---|---|---|---|---|---|---|---|---|---|---|---|---|---|---|---|---|---|---|---|---|---|---|---|---|---|---|---|---|---|---|---|---|---|---|---|---|---|---|---|---|---|---|---|---|---|---|---|---|
| Region | (Dec 2017 – Nov 2022) | (Dec 2018 – Nov 2023) | percent change | Nov 2022 | Nov 2023 | percent change | Nov 2022 | Nov 2023 | ||||||||||||||||||||||||||||||||||||||||||||||||||||||||||||||||||||||||||||||||||||||||||
| East | 981 | 991 | 1.0% | 1,063 | 1,048 | -1.4% | 92% | 95% | ||||||||||||||||||||||||||||||||||||||||||||||||||||||||||||||||||||||||||||||||||||||||||
| Midwest | 1,175 | 1,173 | -0.2% | 1,220 | 1,221 | 0.0% | 96% | 96% | ||||||||||||||||||||||||||||||||||||||||||||||||||||||||||||||||||||||||||||||||||||||||||
| Mountain | 253 | 266 | 5.0% | 472 | 472 | 0.0% | 54% | 56% | ||||||||||||||||||||||||||||||||||||||||||||||||||||||||||||||||||||||||||||||||||||||||||
| Pacific4 | 283 | 360 | 27.4% | 369 | 369 | -0.1% | 77% | 98% | ||||||||||||||||||||||||||||||||||||||||||||||||||||||||||||||||||||||||||||||||||||||||||
| South Central | 1,387 | 1,413 | 1.9% | 1,545 | 1,558 | 0.8% | 90% | 91% | ||||||||||||||||||||||||||||||||||||||||||||||||||||||||||||||||||||||||||||||||||||||||||
| Nonsalt | 992 | 1,003 | 1.1% | 1,072 | 1,076 | 0.4% | 93% | 93% | ||||||||||||||||||||||||||||||||||||||||||||||||||||||||||||||||||||||||||||||||||||||||||
| Salt | 394 | 410 | 4.0% | 473 | 482 | 1.9% | 83% | 85% | ||||||||||||||||||||||||||||||||||||||||||||||||||||||||||||||||||||||||||||||||||||||||||
| Lower 48 | 4,079 | 4,203 | 3.0% | 4,669 | 4,666 | -0.1% | 87% | 90% | ||||||||||||||||||||||||||||||||||||||||||||||||||||||||||||||||||||||||||||||||||||||||||
|
Data source: U.S. Energy Information Administration, Monthly Natural Gas Underground Storage Report Note: Design capacity information for all underground storage facilities, including inactive fields, is available in the Natural Gas Annual Respondent Query System. Totals and calculations may not equal the sum of the components because of independent rounding. Information about storage regions is available in The Basics of Underground Natural Gas Storage. Mentions of specific companies in this report include only information that is publicly available on our website or on the Federal Energy Regulatory Commission (FERC) dockets. 1 Demonstrated peak capacity, otherwise known as the maximum demonstrated working natural gas volume, is the sum of the highest storage inventory levels of working natural gas observed in each distinct storage reservoir during the previous five-year period as reported by the operator on Form EIA-191, Monthly Underground Natural Gas Storage Report. The timing of the peaks for different facilities do not need to coincide. Inactive fields are not included in estimates of working natural gas capacity. 2 Design capacity is an estimate of a natural gas facility's physical working natural gas capacity as reported by the operator on Form EIA-191, Monthly Underground Natural Gas Storage Report. It represents the sum of all fields' capacities at a point in time. It is a measure based on the physical characteristics of the reservoir, installed equipment, and operating procedures particular to the site that are often certified by federal or state regulators. Inactive fields are not included in estimates of working natural gas capacity. 3 Demonstrated peak capacity in some cases exceeds 100% of design capacity because design capacity limits may differ from actual capacity limits in storage fields, as determined by the facility operator and local regulations. 4 The design capacity of Southern California Gas Company’s Aliso Canyon field was included in this report and in the Pacific region totals at 86.2 billion cubic feet, as publicly reported on Form EIA-191. The authorized working natural gas capacity of this facility may be lower because of ongoing operational constraints. |
||||||||||||||||||||||||||||||||||||||||||||||||||||||||||||||||||||||||||||||||||||||||||||||||||
| Demonstrated peak capacity1 | Design capacity2 | Demonstrated peak share of design capacity3 | ||||||||||||||||||||||||||||||||||||||||||||||||||||||||||||||||||||||||||||||||||||||||||||||||
|---|---|---|---|---|---|---|---|---|---|---|---|---|---|---|---|---|---|---|---|---|---|---|---|---|---|---|---|---|---|---|---|---|---|---|---|---|---|---|---|---|---|---|---|---|---|---|---|---|---|---|---|---|---|---|---|---|---|---|---|---|---|---|---|---|---|---|---|---|---|---|---|---|---|---|---|---|---|---|---|---|---|---|---|---|---|---|---|---|---|---|---|---|---|---|---|---|---|---|
| Region | State | (Dec 2017 - Nov 2022) |
(Dec 2018 - Nov 2023) |
Change | Nov 2022 | Nov 2023 | Change | Nov 2022 | Nov 2023 | |||||||||||||||||||||||||||||||||||||||||||||||||||||||||||||||||||||||||||||||||||||||||
| East | PA | 400 | 401 | 2 | 418 | 417 | -2 | 95% | 96% | |||||||||||||||||||||||||||||||||||||||||||||||||||||||||||||||||||||||||||||||||||||||||
| WV | 235 | 238 | 3 | 243 | 241 | -1 | 97% | 99% | ||||||||||||||||||||||||||||||||||||||||||||||||||||||||||||||||||||||||||||||||||||||||||
| MD | 16 | 17 | 1 | 18 | 18 | 0 | 90% | 95% | ||||||||||||||||||||||||||||||||||||||||||||||||||||||||||||||||||||||||||||||||||||||||||
| VA | 5 | 5 | 0 | 5 | 5 | 0 | 105% | 105% | ||||||||||||||||||||||||||||||||||||||||||||||||||||||||||||||||||||||||||||||||||||||||||
| OH | 208 | 212 | 4 | 253 | 241 | -12 | 82% | 88% | ||||||||||||||||||||||||||||||||||||||||||||||||||||||||||||||||||||||||||||||||||||||||||
| NY | 117 | 117 | 0 | 125 | 125 | 0 | 93% | 94% | ||||||||||||||||||||||||||||||||||||||||||||||||||||||||||||||||||||||||||||||||||||||||||
| Total | 981 | 991 | 10 | 1,063 | 1,048 | -15 | 92% | 95% | ||||||||||||||||||||||||||||||||||||||||||||||||||||||||||||||||||||||||||||||||||||||||||
| Midwest | IL | 274 | 273 | -1 | 302 | 302 | 0 | 91% | 91% | |||||||||||||||||||||||||||||||||||||||||||||||||||||||||||||||||||||||||||||||||||||||||
| IA | 85 | 86 | 1 | 90 | 90 | 0 | 94% | 95% | ||||||||||||||||||||||||||||||||||||||||||||||||||||||||||||||||||||||||||||||||||||||||||
| MN | 2 | 2 | 0 | 2 | 2 | 0 | 113% | 113% | ||||||||||||||||||||||||||||||||||||||||||||||||||||||||||||||||||||||||||||||||||||||||||
| TN | 2 | 1 | 0 | 2 | 2 | 0 | 84% | 83% | ||||||||||||||||||||||||||||||||||||||||||||||||||||||||||||||||||||||||||||||||||||||||||
| IN | 30 | 30 | 0 | 29 | 29 | 0 | 103% | 104% | ||||||||||||||||||||||||||||||||||||||||||||||||||||||||||||||||||||||||||||||||||||||||||
| MO | 3 | 33 | 0 | 4 | 4 | 0 | 83% | 83% | ||||||||||||||||||||||||||||||||||||||||||||||||||||||||||||||||||||||||||||||||||||||||||
| KY | 105 | 102 | -3 | 108 | 104 | -4 | 97% | 98% | ||||||||||||||||||||||||||||||||||||||||||||||||||||||||||||||||||||||||||||||||||||||||||
| MI | 675 | 675 | 0 | 684 | 688 | 5 | 99% | 98% | ||||||||||||||||||||||||||||||||||||||||||||||||||||||||||||||||||||||||||||||||||||||||||
| Total | 1,175 | 1,173 | -3 | 1,220 | 1,221 | 1 | 96% | 96% | ||||||||||||||||||||||||||||||||||||||||||||||||||||||||||||||||||||||||||||||||||||||||||
| Mountain | MT | 35 | 36 | 1 | 197 | 197 | 0 | 18% | 18% | |||||||||||||||||||||||||||||||||||||||||||||||||||||||||||||||||||||||||||||||||||||||||
| NE | 12 | 12 | 0 | 13 | 13 | 0 | 95% | 95% | ||||||||||||||||||||||||||||||||||||||||||||||||||||||||||||||||||||||||||||||||||||||||||
| UT | 53 | 53 | 0 | 55 | 55 | 0 | 96% | 97% | ||||||||||||||||||||||||||||||||||||||||||||||||||||||||||||||||||||||||||||||||||||||||||
| NM | 42 | 43 | 1 | 60 | 60 | 0 | 70% | 72% | ||||||||||||||||||||||||||||||||||||||||||||||||||||||||||||||||||||||||||||||||||||||||||
| CO | 64 | 66 | 1 | 73 | 73 | 0 | 88% | 90% | ||||||||||||||||||||||||||||||||||||||||||||||||||||||||||||||||||||||||||||||||||||||||||
| WY | 48 | 56 | 8 | 74 | 74 | 0 | 65% | 76% | ||||||||||||||||||||||||||||||||||||||||||||||||||||||||||||||||||||||||||||||||||||||||||
| Total | 253 | 266 | 13 | 472 | 472 | 0 | 54% | 56% | ||||||||||||||||||||||||||||||||||||||||||||||||||||||||||||||||||||||||||||||||||||||||||
| Pacific | WA | 24 | 24 | 0 | 25 | 25 | 0 | 96% | 96% | |||||||||||||||||||||||||||||||||||||||||||||||||||||||||||||||||||||||||||||||||||||||||
| OR | 22 | 22 | -1 | 22 | 22 | 0 | 104% | 101% | ||||||||||||||||||||||||||||||||||||||||||||||||||||||||||||||||||||||||||||||||||||||||||
| CA4 | 237 | 315 | 78 | 323 | 322 | -1 | 73% | 98% | ||||||||||||||||||||||||||||||||||||||||||||||||||||||||||||||||||||||||||||||||||||||||||
| Total | 283 | 360 | 78 | 369 | 369 | -1 | 77% | 98% | ||||||||||||||||||||||||||||||||||||||||||||||||||||||||||||||||||||||||||||||||||||||||||
| South Central | MS | 152 | 154 | 2 | 202 | 201 | 0 | 75% | 76% | |||||||||||||||||||||||||||||||||||||||||||||||||||||||||||||||||||||||||||||||||||||||||
| AR | 6 | 6 | 0 | 9 | 9 | 0 | 63% | 68% | ||||||||||||||||||||||||||||||||||||||||||||||||||||||||||||||||||||||||||||||||||||||||||
| KS | 115 | 117 | 2 | 123 | 123 | 0 | 94% | 95% | ||||||||||||||||||||||||||||||||||||||||||||||||||||||||||||||||||||||||||||||||||||||||||
| AL | 27 | 27 | 0 | 33 | 33 | 0 | 80% | 80% | ||||||||||||||||||||||||||||||||||||||||||||||||||||||||||||||||||||||||||||||||||||||||||
| LA | 420 | 423 | 3 | 454 | 456 | 2 | 93% | 93% | ||||||||||||||||||||||||||||||||||||||||||||||||||||||||||||||||||||||||||||||||||||||||||
| OK | 173 | 178 | 5 | 198 | 202 | 4 | 87% | 88% | ||||||||||||||||||||||||||||||||||||||||||||||||||||||||||||||||||||||||||||||||||||||||||
| TX | 494 | 509 | 15 | 527 | 534 | 7 | 94% | 95% | ||||||||||||||||||||||||||||||||||||||||||||||||||||||||||||||||||||||||||||||||||||||||||
| Total | 1,387 | 1,413 | 26 | 1,545 | 1,558 | 13 | 90% | 91% | ||||||||||||||||||||||||||||||||||||||||||||||||||||||||||||||||||||||||||||||||||||||||||
| Lower 48 | 4,079 | 4,203 | 124 | 4,669 | 4,666 | -2 | 87% | 90% | ||||||||||||||||||||||||||||||||||||||||||||||||||||||||||||||||||||||||||||||||||||||||||
|
Data source: U.S. Energy Information Administration, Monthly Underground Natural Gas Storage Report Note: Design capacity information for all facilities, including inactive fields, is available in the Natural Gas Annual Respondent Query System. Totals and calculations may not equal the sum of the components because of independent rounding. Information about storage regions is available in The Basics of Underground Natural Gas Storage. Mentions of specific companies in this report include only information that is publicly available in our query system. 1 Demonstrated peak capacity, otherwise known as the maximum demonstrated working natural gas volume, is the sum of the highest storage inventory levels of working natural gas observed in each distinct storage reservoir during the previous five-year period as reported by the operator on the Form EIA-191, Monthly Underground Natural Gas Storage Report. The timing of the peaks for different facilities do not need to coincide. Inactive fields are not included in estimates of working natural gas capacity. 2 Design capacity is an estimate of a natural gas facility's physical working natural gas capacity as reported by the operator on the Form EIA-191, Monthly Underground Natural Gas Storage Report. It represents the sum of all fields' capacities at a point in time. It is a measure based on the physical characteristics of the reservoir, installed equipment, and operating procedures particular to the site that are often certified by federal or state regulators. Inactive fields are not included in estimates of working natural gas capacity. 3 Peak capacity in some cases exceeds 100% of design capacity because design capacity limits may differ from actual capacity limits in storage fields, as determined by the facility operator and local regulations. Maximum demonstrated working natural gas volume more commonly exceeds design capacity in states with a smaller number of facilities and smaller total storage volumes. In instances where storage fields reduce working natural gas capacity, demonstrated peak capacity may exceed design capacity. 4 The design capacity of Southern California Gas Company’s Aliso Canyon field was included in this report and in the Pacific region totals at 86.2 billion cubic feet, as publicly reported on Form EIA-191. The authorized working natural gas capacity of this facility may be lower because of ongoing operational constraints. |
||||||||||||||||||||||||||||||||||||||||||||||||||||||||||||||||||||||||||||||||||||||||||||||||||
State-level design capacity decreased in the East region and increased primarily in the South Central region. Working gas design capacity declined primarily in Ohio, and Pennsylvania and West Virginia also reported declines as a result of Columbia’s base gas restoration program. Increases in the South Central region occurred in Texas, Oklahoma, and Louisiana. As mentioned earlier, the completion of the storage facility at Atmos resulted in the region’s largest increase in working gas design capacity. The completion of the Egan workover project increased working natural gas design capacity in Louisiana, and OneOK’s reclassification of some of its base gas to working gas increased the capacity of its facility in Oklahoma.
State-level increases in demonstrated peak capacity occurred primarily in California, Texas, and Wyoming. Demonstrated peak capacity rose 78 Bcf in California. Texas had the next-largest increase, at 15 Bcf, and Wyoming had the third-largest increase in 2023.